Thank you to the Dallas OUG for letting me present recently on my "Oracle Dataguard Deep Dive" topic. I also covered 12c new features as well in this presentation. You may view my presentation at the following link.
http://tinyurl.com/hq5h7s3
Sunday, December 4, 2016
Wednesday, September 14, 2016
Important Settings on Every Oracle Database Build!
Today I worked on a problem on an Oracle Supercluster M7 system. The issue was that we have about 15 databases running from a single I/O DB Domain it is basically a Virtual Machine(VM). The total allocated SGA/PGA memory across all of these 12c(12.1.0.2) databases was set to a total sum of 60GB and the whole VM has 192GB of memory assigned to it however when I checked the free memory I only showed about 3-4GB available. This did not make sense at all and it did not add up since I only allocated 60GB across all databases. A few issues that we experienced other than the limited memory was also that we got consistent related errors as a result of the limited memory across the database alert logs.
ORA-00604: error occurred at recursive SQL level 1
ORA-04031: unable to allocate 128 bytes of shared memory
ORA-00700: soft internal error, arguments: [kskvmstatact: excessive swapping observed]
ORA-27300: OS system dependent operation:fork failed with status: 12
ORA-04030: out of process memory when trying to allocate 552 bytes (kxs-heap-p,kxfqlobf)
BTW Please keep in mind this issue can also apply to other systems as well such as Exadata, a Physical server or any VM running oracle databases.
I started to dig and troubleshoot.
prstat -t output below shows total memory usage by user on Solaris. Look at the RSS column below it clearly shows 144GB of memory being used by the oracle user. I was surprised to see this.
NPROC USERNAME SWAP RSS MEMORY TIME CPU
85 root 2520M 2481M 1.3% 87:40:45 0.2%
5462 oracle 183G 144G 75% 197:27:56 0.2%
51 grid 17G 12G 6.4% 34:47:13 0.0%
1 smmsp 4272K 10M 0.0% 0:00:06 0.0%
7 daemon 9384K 12M 0.0% 0:00:54 0.0%
1 netcfg 4344K 7240K 0.0% 0:00:24 0.0%
3 netadm 46M 46M 0.0% 0:00:45 0.0%
I then wanted to see a list of process sorted by memory usage I also added cpu time, the process id and the command and sorted by the memory column from largest usage to lowest as shown in the following command. The output showed that the largest processes were oracle and all of them were about the same size based on the pmem column which shows the output in terms of a %.
# ps -eo pmem,pcpu,pid,comm | sort -k 1 -nr |wc -l
I also wanted to see a total process count on the server so I ran the following command it returned about 6000 processes, so many.
# ps -ef| wc -l
..And the plot thickens then I thought about checking to see if we have too many parallel process threads running and I ran the following command to check and verify this.The following command returned about 4800 rows! Now we are on to something this clearly shows that about 80% of the processes running on the VM are all parallel threads, this is way to much.
ps -eo pmem,pcpu,pid,comm | sort -k 1 -nr |grep -i _p0|wc -l
The parallel_max_servers database init parameter in 12c is a culprit for this and it should be limited. If this parameter is not set it will take the default value which is based upon the settings from CPU_COUNT, PARALLEL_THREADS_PER_CPU, and PGA_AGGREGATE_TARGET.
The CPU_COUNT database init parameter should also be limited as well. If the default value is taken then the database will take upon the value reported by the total cpu threads reported from the OS. In my case we have 20 CPU cores assigned to the VM and on the M7 Supercluster each CPU has 32 cores with 8 threads each a total of 256 threads per core.So 20 cores assigned to the VM is 160 threads and can set CPU_COUNT accordingly based on the workload need.
The PARALLEL_THREADS_PER_CPU is normally OS dependent and usually 2. This setting is fine.
Once I appropriately set the CPU_COUNT and PARALLEL_MAX_SERVERS parameters on each of the 16 databases and restarted each one I was happy to see the overall memory utilization dramatically decreased. As shown below in the prstat command.
# prstat -t
NPROC USERNAME SWAP RSS MEMORY TIME CPU
764 oracle 80G 56G 29% 14:33:54 0.1%
94 root 2525M 2493M 1.3% 88:14:08 0.1%
53 grid 8239M 6759M 3.4% 34:26:20 0.0%
1 smmsp 4272K 10M 0.0% 0:00:06 0.0%
7 daemon 9384K 12M 0.0% 0:00:55 0.0%
1 netcfg 4344K 7240K 0.0% 0:00:24 0.0%
3 netadm 46M 46M 0.0% 0:00:45 0.0%
In Summary the following two parameters should be set appropriately on every new Oracle Database build. As a best practice please limit these parameters as the default settings could hurt the overall performance of your system and even impact the available memory as it did in our case. I have even see many cases where the PARALLEL_MAX_SERVERS was not set and it completely hung an Exadata or other types of database servers so please be mindful of these two parameters.
ORA-00604: error occurred at recursive SQL level 1
ORA-04031: unable to allocate 128 bytes of shared memory
ORA-00700: soft internal error, arguments: [kskvmstatact: excessive swapping observed]
ORA-27300: OS system dependent operation:fork failed with status: 12
ORA-04030: out of process memory when trying to allocate 552 bytes (kxs-heap-p,kxfqlobf)
I started to dig and troubleshoot.
prstat -t output below shows total memory usage by user on Solaris. Look at the RSS column below it clearly shows 144GB of memory being used by the oracle user. I was surprised to see this.
NPROC USERNAME SWAP RSS MEMORY TIME CPU
85 root 2520M 2481M 1.3% 87:40:45 0.2%
5462 oracle 183G 144G 75% 197:27:56 0.2%
51 grid 17G 12G 6.4% 34:47:13 0.0%
1 smmsp 4272K 10M 0.0% 0:00:06 0.0%
7 daemon 9384K 12M 0.0% 0:00:54 0.0%
1 netcfg 4344K 7240K 0.0% 0:00:24 0.0%
3 netadm 46M 46M 0.0% 0:00:45 0.0%
I then wanted to see a list of process sorted by memory usage I also added cpu time, the process id and the command and sorted by the memory column from largest usage to lowest as shown in the following command. The output showed that the largest processes were oracle and all of them were about the same size based on the pmem column which shows the output in terms of a %.
# ps -eo pmem,pcpu,pid,comm | sort -k 1 -nr |wc -l
I also wanted to see a total process count on the server so I ran the following command it returned about 6000 processes, so many.
# ps -ef| wc -l
..And the plot thickens then I thought about checking to see if we have too many parallel process threads running and I ran the following command to check and verify this.The following command returned about 4800 rows! Now we are on to something this clearly shows that about 80% of the processes running on the VM are all parallel threads, this is way to much.
ps -eo pmem,pcpu,pid,comm | sort -k 1 -nr |grep -i _p0|wc -l
The parallel_max_servers database init parameter in 12c is a culprit for this and it should be limited. If this parameter is not set it will take the default value which is based upon the settings from CPU_COUNT, PARALLEL_THREADS_PER_CPU, and PGA_AGGREGATE_TARGET.
The CPU_COUNT database init parameter should also be limited as well. If the default value is taken then the database will take upon the value reported by the total cpu threads reported from the OS. In my case we have 20 CPU cores assigned to the VM and on the M7 Supercluster each CPU has 32 cores with 8 threads each a total of 256 threads per core.So 20 cores assigned to the VM is 160 threads and can set CPU_COUNT accordingly based on the workload need.
The PARALLEL_THREADS_PER_CPU is normally OS dependent and usually 2. This setting is fine.
Once I appropriately set the CPU_COUNT and PARALLEL_MAX_SERVERS parameters on each of the 16 databases and restarted each one I was happy to see the overall memory utilization dramatically decreased. As shown below in the prstat command.
# prstat -t
NPROC USERNAME SWAP RSS MEMORY TIME CPU
764 oracle 80G 56G 29% 14:33:54 0.1%
94 root 2525M 2493M 1.3% 88:14:08 0.1%
53 grid 8239M 6759M 3.4% 34:26:20 0.0%
1 smmsp 4272K 10M 0.0% 0:00:06 0.0%
7 daemon 9384K 12M 0.0% 0:00:55 0.0%
1 netcfg 4344K 7240K 0.0% 0:00:24 0.0%
3 netadm 46M 46M 0.0% 0:00:45 0.0%
In Summary the following two parameters should be set appropriately on every new Oracle Database build. As a best practice please limit these parameters as the default settings could hurt the overall performance of your system and even impact the available memory as it did in our case. I have even see many cases where the PARALLEL_MAX_SERVERS was not set and it completely hung an Exadata or other types of database servers so please be mindful of these two parameters.
- CPU_COUNT
- PARALLEL_MAX_SERVERS
Tuesday, September 13, 2016
Dallas Oracle Users Group - Presenting "Oracle Dataguard Deep Dive"
I am very excited and honored to be presenting at the Dallas Oracle Users Group soon on Sept 22, 2016. The topic is "Oracle Dataguard Deep Dive". Session details below.
To RSVP for this meeting: http://www.doug.org/calendar.html#id=10163&cid=538&wid=201&type=Cal
Location
Texas State Government Facility (education-related)
- Use building Entrance C on SE side
Dallas Room – 1st floor
400 East Spring Valley Road
Richardson, Texas, 75081
Presentation Details
Oracle Data Guard Deep Dive
Ensuring your business continuity for critical production databases is of paramount importance. Oracle Data Guard offers high available synchronization and reporting of your primary database. Oracle Data Guard is the most comprehensive solution available to eliminate single points of failure for mission critical Oracle Databases. It prevents data loss and downtime in the simplest and most economical manner by maintaining a synchronized physical replica of a production database at a remote location. If the production database is unavailable for any reason, client connections can quickly, and in some configurations transparently, fail-over to the synchronized replica to restore service. We will go through explaining Data Guard concepts, several new features in 12c such as Far/Fast sync, learn about Data Guard single instance and RAC setup step-by-step, configuration, broker setup and monitoring, and even tips on automating the complete setup. This presentation will be very useful for someone who wants to take a deep dive into Data Guard or even refresh their skills.
Wednesday, June 15, 2016
Calculate Exadata X6 Storage space available for ASM Normal and High Redundancy
When reviewing the datasheet for the Exadata X6 the latest release you may want to understand how much usable space will be available for you to use for Normal and High Redundancy in ASM for your diskgroups.
Each Exadata X6 storage cell comes with 12 x 8TB SAS 7200 RPM disks with a total Raw capacity of 96TB for each cell. Now if you want to see how to calculate the Normal or High redundancy for example of a Quarter Rack it is not simply taking the raw storage amount divided by 2 for Normal redundancy and 3 for High redundancy. The formula is below and I confirmed this with Oracle Support as well.
Please note: The amount of storage that needs to be reserved to recover from the failure of a disk is 15% of the cell disk capacity.
# cellcli -e list celldisk attributes name,size
CD_00_internal 7.1192474365234375T
...
The calculation is as follows -
Size of one disk : 7.1192474365234375TB
Disks per cell node : 12
No of cell nodes : 3
Total size of Disk : 7.119TB * 12 * 3 = 256.284TB
Normal Redundancy = [ Total size of Disk / 2 ] * .85
= [ 256.284TB / 2 ] * .85
= 128.142TB * .85
=> 108.9207TB or 109TB [ The value in the Exadata X6 data sheet ]
High Redundancy = [ Total size of Disk / 3 ] * .85
= [ 256.284TB / 3 ] * .85
= 85.428TB * .85
=> 72.6138TB
A table below also shows this information to easily see the values on the different size configurations.
Friday, May 20, 2016
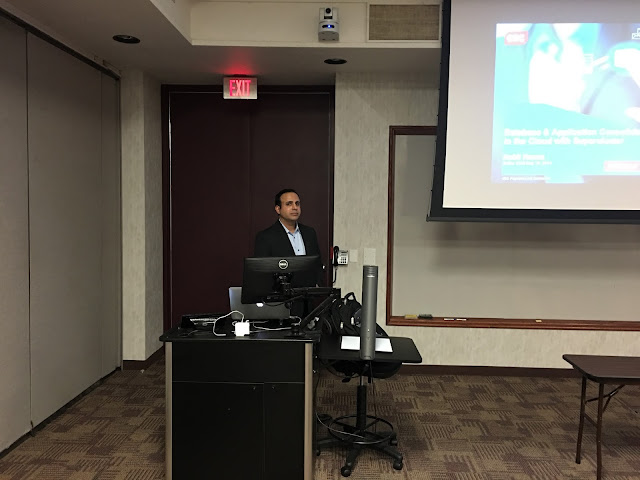
Dallas Oracle Users Group session photos from Supercluster session
I wanted to thank the organizers at the Dallas Oracle Users Group (DOUG) and also Computer Science Corporation (CSC) for sponsoring and supporting my session on "Database & Application Consolidation in the Cloud with Supercluster" last night. Thank you also to everyone who was able to come and attend. Thanks also to Ted Francisco a sales leader in our Oracle practice who flew in from Atlanta to attend the event to support me.
I am sharing from photos from the session below.


I am sharing from photos from the session below.


Subscribe to:
Posts (Atom)